

June Perth Property Report

It doesn’t seem that long ago that everyone was making their predictions about the year ahead and setting new goals but we have now reached the halfway point of 2014. Maybe it is time to sit back, take a deep breath, reassess and set yourself up for what is to come. After all last year values rose by 3.0% over the first six months of 2013 followed by a 6.6% capital gain over the second half.
Capital city home values fell by 1.9% for May, the first time negative growth has been recorded in 11 months. It should be noted that generally the month of May is a seasonally weak time for housing markets and the month has had a decline in values for the past three years. The combined decrease of 1.59% for April and May is smaller than the 1.67% fall recorded over the same period in 2013 and the 2.06% fall recorded in 2012.
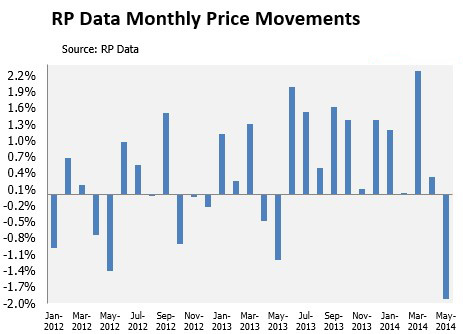
Each capital city has recorded growth in dwelling values over the 12 months to May but Sydney (16.6%) and Melbourne (9.9%) have been the primary drivers for capital gains over the past year. Combined capital city home values increased by 10.7%, skewed by Sydney which is the only city greater than the mean. Perth recorded growth of 5.7% in that period but is unchanged in the past three months. Only Darwin (5.5%), Brisbane and Sydney (both 2.2%) had growth greater than 2% in the quarter to May while Melbourne experienced the only decrease with prices falling by 1.9%.
Perth’s current median prices are $544,500 for houses and $445,000 for units. Both property types are lower than the national average of $575,000 and $480,000 respectively. It should be noted that Sydney’s house value of $800,00 is almost $200,000 dearer than the next highest, which is Melbourne, while units, $576,000 are more than $100,000 so the average is distorted to an extent. Hobart is the most affordable with dwelling values of $370,000 and $230,00 respectively. If you are looking for a cheaper entrance into the market then consider purchasing a unit as the average difference is $95,000 compared to their counterpart around the country.
Property conditions continue to trend higher since the last trough back in June 2012. Prices are 13.7% higher since then and are 10.7% greater than the same time a year ago. Another indication of how strong the market has been performing is that home values rose 3.8% over the 2012/13 financial year compared to 8.6% so far this financial year.

The impressive performance of the market has resulted in value growth outpacing rental growth resulting in yields trending lower. Across the combined capital cities, rents sit at $485/week for houses and $453/week for units. In comparison Perth’s weekly rent sits at $504, 4.2% yield, for houses (decrease of 0.7% for the quarter and 1.1% for the year) and $452, 4.8% yield, for units (0.8% decrease for the quarter and no change for the year). Capital city rents have increased by 2.2% for houses and by 2.8% for units over the past 12 months. As a result gross rental yields across the country are currently recorded at 3.9% for houses and 4.7% for units, down from 4.2% and 5% respectively at the same time last year.
With the second half upon us, will the market kick on for a winner or run out of steam?
If you are looking to invest and need finance please contact us today on (08) 9289 7777 and we will find you the best deal at the lowest rate for you, obligation free.
Source: RP Data